Until recently economists were certain that finance has absolutely nothing to offer macroeconomics on the level theory or practice. In the center of economic theory were money supply and interest rates. However In real world when a homeowner takes out a loan and using say a house as collateral, he must negotiate not only just the interest rate, but also how much he can borrow. In other words equally important to interest rate is leverage rate. Let’s take a look on a simple example (I took this example from John Geanakoplos paper The Leverage cycle who together with Hyun Song Shin deserves credit for excellent analysis of leverage and collateral for functioning the financial system)
If the house costs USD100k he borrows USD80k and pay USD20k in cash we say that the collateral rate is USD100k/USD80K=125% the leverage is USD100k/USD20k =5 loan value is USD80k/USD100k = 80%. If then the value of the house raises let say by 20% collateral rate rises to 150%, the loan value drops to 67% and the leverage drops to 4.
In general leverage falls when value of total assets rise. For households, the change in the leverage and change in size of balance sheet size are negatively correlated. However the picture for financial intermediaries is very different. (This is well documented in the series of papers by Hyun Song Shin. Here you can find a link to her web page at Princeton University).
First let’s assume that the bank or other financial intermediary wants to maintain a constant leverage ratio of 10. It keeps securities worth 100 finances is assets with debt worth 90.
--------ASSETS ---LIABILITIES
Securities 100---- 10 Capital
------------------------90 Debt
Now let’s assume that value of securities increases by 1% to 101. Now the balance sheet looks like this:
-------ASSETS ---LIABILITIES
Securities 101 ---11 Capital
-----------------------90 Debt
Leverage drops to 9.18 but the banks wants to keep it constant at 10 and it has to purchase securities worth 9 and finance this purchase with additional debt. Thus, an increase in the price of the security leads to an increased holding worth 9 So the demand curve is upward sloping
---------ASSETS ---LIABILITIES
Securities 110 ---11 Capital
------------------------99 Debt
This mechanism works in reverse too. If now the securities prices fall so the value of assets kept on balance sheet inches down to 109 the leverage now is to high 109 to 10= 10.9. The bank has to adjust down its leverage by selling securities worth 9.
---------ASSETS--- LIABILITIES
Securities 109 ---10 Capital
-------------------------99 Debt
Thus a fall in the price of securities leads to sales of securities which mean that the supply curve is downward sloping. Leverage targeting entails upward sloping demands and downward sloping supplies.
But in real world financial intermediaries are far from being passive in adjusting their balance sheets. Leverage sector (banks, brokerage houses, hedge funds etc.) uses Value at Risk models to adjust their balances sheets. Adrian and Shin showed that procyclical leverage can be traced to the counter-cyclical nature of VaR.
In other words greater demand for the assets tends to put upward pressure on its prices, and then there is a feedback effect in which stronger balance sheets feed greater demand for the asset which in turn raises the asset price and lead to stronger bigger balance sheets. This process if unchecked can lead asset prices up to the shy and then down to the hell (as this process works in reverse too)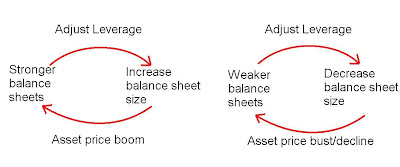
That’s why in absence of intervention leverage becomes too high in boom times and too low in bad times (bust). As result , in boom times asset prices are too high, and in crisis time they are too low. This is the leverage cycle.
Eastern Europe boom and bust
Investment bank portfolios are marked to market but the commercial banks balance sheet is not directly affected by changes in asset prices. The reason behind is that usually the biggest item on the balance sheet of commercial banks are loans to consumers (credit) which are not mark to marked. Figure 1 is a scatter chart of the change in leverage and change in total assets of 5 biggest Ukrainian banks (2000-2008). I choose Ukrainian banks as Ukraine and Baltic countries (Lithuania, Latvia, Estonia) suffers in the aftermath of financial crises the worst GDP contraction in whole CEE region. Although I had access only to limited number of observations but most of the observations are concentrated along the vertical line which suggest that Ukrainian commercial banks were targeting constant leverage ratio.
Even in absence of asset price changes (loans, credit) there is potential room for feedback between the balance sheet size and asset prices through shifts in perceived risk.
As I mentioned earlier when the homeowner takes out a loan and using say a house as collateral, he must negotiate not only just the interest rate, but also how much he can borrow. If then the home price increases the collateral ratio raises which may give false impression that the credit risk is falling.
Read More......
If the house costs USD100k he borrows USD80k and pay USD20k in cash we say that the collateral rate is USD100k/USD80K=125% the leverage is USD100k/USD20k =5 loan value is USD80k/USD100k = 80%. If then the value of the house raises let say by 20% collateral rate rises to 150%, the loan value drops to 67% and the leverage drops to 4.
In general leverage falls when value of total assets rise. For households, the change in the leverage and change in size of balance sheet size are negatively correlated. However the picture for financial intermediaries is very different. (This is well documented in the series of papers by Hyun Song Shin. Here you can find a link to her web page at Princeton University).
First let’s assume that the bank or other financial intermediary wants to maintain a constant leverage ratio of 10. It keeps securities worth 100 finances is assets with debt worth 90.
--------ASSETS ---LIABILITIES
Securities 100---- 10 Capital
------------------------90 Debt
Now let’s assume that value of securities increases by 1% to 101. Now the balance sheet looks like this:
-------ASSETS ---LIABILITIES
Securities 101 ---11 Capital
-----------------------90 Debt
Leverage drops to 9.18 but the banks wants to keep it constant at 10 and it has to purchase securities worth 9 and finance this purchase with additional debt. Thus, an increase in the price of the security leads to an increased holding worth 9 So the demand curve is upward sloping
---------ASSETS ---LIABILITIES
Securities 110 ---11 Capital
------------------------99 Debt
This mechanism works in reverse too. If now the securities prices fall so the value of assets kept on balance sheet inches down to 109 the leverage now is to high 109 to 10= 10.9. The bank has to adjust down its leverage by selling securities worth 9.
---------ASSETS--- LIABILITIES
Securities 109 ---10 Capital
-------------------------99 Debt
Thus a fall in the price of securities leads to sales of securities which mean that the supply curve is downward sloping. Leverage targeting entails upward sloping demands and downward sloping supplies.
But in real world financial intermediaries are far from being passive in adjusting their balance sheets. Leverage sector (banks, brokerage houses, hedge funds etc.) uses Value at Risk models to adjust their balances sheets. Adrian and Shin showed that procyclical leverage can be traced to the counter-cyclical nature of VaR.
In other words greater demand for the assets tends to put upward pressure on its prices, and then there is a feedback effect in which stronger balance sheets feed greater demand for the asset which in turn raises the asset price and lead to stronger bigger balance sheets. This process if unchecked can lead asset prices up to the shy and then down to the hell (as this process works in reverse too)
(chart reproduced from Adrian and Shin )

That’s why in absence of intervention leverage becomes too high in boom times and too low in bad times (bust). As result , in boom times asset prices are too high, and in crisis time they are too low. This is the leverage cycle.
Eastern Europe boom and bust
Investment bank portfolios are marked to market but the commercial banks balance sheet is not directly affected by changes in asset prices. The reason behind is that usually the biggest item on the balance sheet of commercial banks are loans to consumers (credit) which are not mark to marked. Figure 1 is a scatter chart of the change in leverage and change in total assets of 5 biggest Ukrainian banks (2000-2008). I choose Ukrainian banks as Ukraine and Baltic countries (Lithuania, Latvia, Estonia) suffers in the aftermath of financial crises the worst GDP contraction in whole CEE region. Although I had access only to limited number of observations but most of the observations are concentrated along the vertical line which suggest that Ukrainian commercial banks were targeting constant leverage ratio.
Even in absence of asset price changes (loans, credit) there is potential room for feedback between the balance sheet size and asset prices through shifts in perceived risk.
As I mentioned earlier when the homeowner takes out a loan and using say a house as collateral, he must negotiate not only just the interest rate, but also how much he can borrow. If then the home price increases the collateral ratio raises which may give false impression that the credit risk is falling.

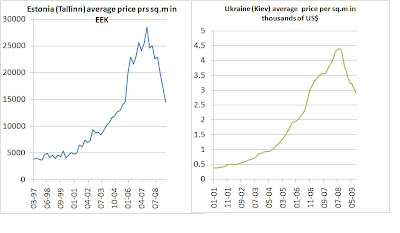
Figure 2 is a chart of average flat prices in capitals of Ukraine (Kiev), and Estonia (Tallinn). I choose home prices as a “natural estimator” of collateral value as credit boom in CEE was mainly driven by surge in number of mortgages. The chart shows that the prices not only raise but also its pace of growth accelerated as time passes reaching maximum in 2008. This was an effect of slowly (at the beginning) accelerating credit growth, which pushes up the collateral ratio and then shifts down perceived risks. Loan officers were more willing to lend as the collateral ratio keep exploding. The more credit was given the higher was the value of collateral the higher was the credit needed for purchasing home which further erodes the lending standards.
Positive feedback process between the credit and collateral value starts slowly at the beginning the credit is soundly based. But as the amount of debt accumulates, total lending increases in importance and begins to have leading appreciable effect on collateral values.
According to standard economic theory markets are fully efficient and only revelation of new important information can cause a crash. But standard economic theory neither can explain creation of the bubbles nor bust of it. The leverage much better explains the economic process of asset price boom and bust. Question is whether it is possible to predict coming asset price bust? According to Nassim Taleb author of famous book “ the black swan” high impact rare events are unpredictable as their share all characteristic of smaller events.
Positive feedback process between the credit and collateral value starts slowly at the beginning the credit is soundly based. But as the amount of debt accumulates, total lending increases in importance and begins to have leading appreciable effect on collateral values.

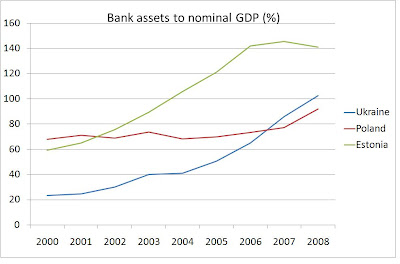
Figure 3 is a chart of commercial bank assets to GDP ratio in Estonia , Poland, and Ukraine. In Estonia and in Ukraine the ratio grows very rapidly which underlines growth of credit in leading role in the process of asset prices/value collateral surge.
Tipping points, Black Swans and Red Dragons
According to standard economic theory markets are fully efficient and only revelation of new important information can cause a crash. But standard economic theory neither can explain creation of the bubbles nor bust of it. The leverage much better explains the economic process of asset price boom and bust. Question is whether it is possible to predict coming asset price bust? According to Nassim Taleb author of famous book “ the black swan” high impact rare events are unpredictable as their share all characteristic of smaller events.
However Didier Sornette in series of papers showed that high impact rare events may be predictable as they belong to a statistical population, which is different from a bulk of the distribution of smaller events, requires some additional amplification mechanism. He argues that extreme events are even “wilder” than predicted by extrapolation of the power law distribution. He calls these outliers a kings or dragons. Emergence of these wild events requires a positive feedback mechanism which leads to increase cooperative of the whole system , leading to development of endogenous instabilities.
(chart reproduced from D.Sornette presentation)
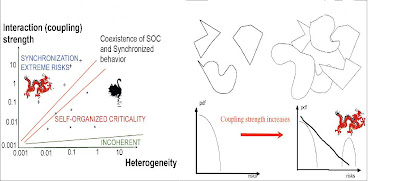
This is complex system approach which is quite different forms “analytical” economics approach which favors decomposing system in components and analyzing it separately to understand the functioning of the whole. “Analytical” approach is destroying information about interactions/linkages between the parts of the system which may lead to some surprising “emergent” properties of the whole.

This is complex system approach which is quite different forms “analytical” economics approach which favors decomposing system in components and analyzing it separately to understand the functioning of the whole. “Analytical” approach is destroying information about interactions/linkages between the parts of the system which may lead to some surprising “emergent” properties of the whole.
The emergent property of leverage sector (i.e Banks) comes competition which leads to synchronization of risk exposure. Let’s imagine a borrower who is coming to the bank for mortgage and says that another bank down the block offers him a credit in value of 110% of real estate he wants to buy instead of 50% he is getting here. If the bank would not follow competitors excessive lending policy its balance sheet would not grow fast enough to stop competitors from takeover, management could be replaced for unimpressive profits etc… Pretty soon both banks eases the lending standards which keep feeding positive feedback process from balance sheet size to asset prices.
The process continues until a tipping point is reached where total credit cannot increase fast enough to continue stimulating asset prices but the whole system is sharing similar risk (real estate). At that time system as a whole is very sensitive to even a small shock but the source of the crash lies in its emergent fundamental instability.
This tipping point is analogues of critical points studied in statistical physics and system before reaches that point may sending precursory signals which can be modeled by LPPL(Log –periodic power Laws.)


